How to troubleshoot a slow website starts with the URL, the time window, and who is affected. Split one load into DNS, connection, TLS, waiting for the first byte, body download, and rendering. Hosting, CDN, database, and frontend changes only help after that interval has an owner.
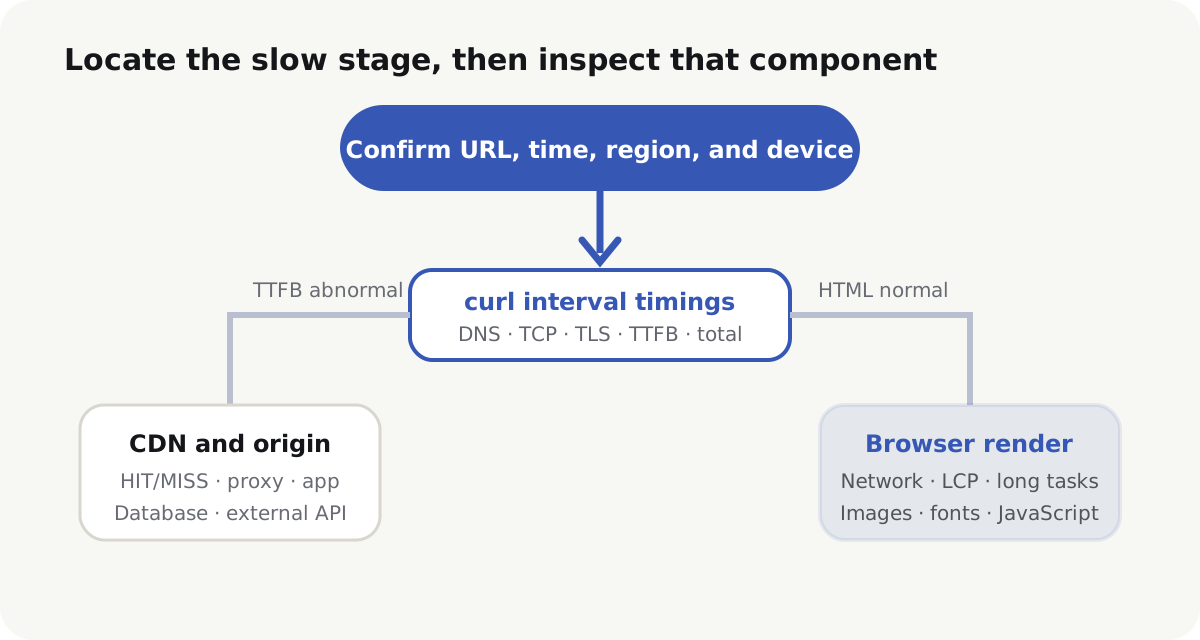
Start troubleshooting a slow website from the affected URL
Record the incident before opening a profiler:
- the exact URL, not only the domain
- the time and time zone
- the user’s region, network, and device
- login state, cache state, and the path they took
- whether the slowness is constant, first-visit only, or a spike
If only one user is slow, inspect that machine’s resolver, proxy, network, extensions, and cache first. If several regions slow down together, inspect CDN, the public entry, and origin. If one page or action is slow, enter that route’s APIs, queries, and third-party calls.
Split network and first-byte time with curl
curl -sS -o /dev/null \
  -w $'code=%{http_code}\nremote=%{remote_ip}\ndns=%{time_namelookup}\nconnect=%{time_connect}\ntls=%{time_appconnect}\nttfb=%{time_starttransfer}\ntotal=%{time_total}\n' \
  https://example.com/path
curl --write-out(opens in a new tab) timestamps are seconds from the start of the transfer. Stage duration is the difference between adjacent values:
| Interval | Approximate calculation | First place to look when it is large |
|---|---|---|
| DNS | time_namelookup | Local resolver, authoritative DNS, records, and cache |
| TCP | time_connect - time_namelookup | Routing, loss, entry region, and port |
| TLS | time_appconnect - time_connect | Round trips, certificate chain, protocol, and session reuse |
| Wait after TLS | time_starttransfer - time_appconnect | CDN origin fetch, proxy, application, database, and external APIs |
| Body download | time_total - time_starttransfer | Response size, compression, bandwidth, and rate limits |
time_starttransfer is time to the first byte from the start of the request, including DNS, TCP, and TLS. Connection reuse, HTTP/3, a proxy, and synthetic local DNS change the shape of these numbers. If remote_ip is a proxy, this sample is not the user’s path to origin.
Measure several times from the same place, then compare another region or network. Use the median and the high percentiles. The fastest run is not daily experience.
When TTFB is high, split CDN from origin
Time to First Byte(opens in a new tab) is the time from the start of navigation until the first byte of the response arrives. It is not application-function time. web.dev includes redirect time, service worker startup when one is involved, DNS lookup, connection and TLS, and the wait until that first byte. As a rough guide, most sites should keep TTFB at 0.8 seconds or less for the 75th percentile; values above 1.8 seconds are poor. TTFB is not a Core Web Vital. It still sets a floor for Largest Contentful Paint(opens in a new tab), which should occur within 2.5 seconds at the same percentile.
Chrome’s Network panel names a narrower interval. Waiting (TTFB)(opens in a new tab) is the browser waiting for the first byte after the request is sent: one round trip plus the time the server spent preparing the response. DNS, TCP, and TLS sit in other bars. A high Waiting value is still not proof that a specific backend function is slow.
The Lighthouse server response audit(opens in a new tab) excludes DNS lookup and redirects, so it is only a subset of field TTFB. Field TTFB also includes redirects that lab tools often skip by testing the final URL.
For the same public asset, request it twice and read cache headers:
curl -sS -D /tmp/first.headers -o /dev/null https://cdn.example.com/image.webp
curl -sS -D /tmp/second.headers -o /dev/null https://cdn.example.com/image.webp

grep -Ei '^(age|cache-control|etag|server|via|x-cache|cf-cache-status):' \
  /tmp/first.headers /tmp/second.headers
A fast HIT and a slow MISS point at the origin fetch path. If HIT and MISS are both slow, inspect the edge, the path from the user to the CDN, and whether the response actually entered the expected front door. An origin test must keep Host and SNI. A bare IP request is a different site.
Find the slowest request in the Network panel
Chrome DevTools Network(opens in a new tab) records the document, CSS, JavaScript, fonts, images, and APIs. Before recording, write down:
- whether Disable cache is on
- whether network or CPU throttling is on
- whether site data was cleared
- device, browser version, and viewport
- whether this is a first visit or a repeat visit
Sort by Duration, Size, and Initiator. Look first at the document’s Waiting (TTFB), render-blocking CSS and fonts, oversized or wrongly sized images, serial APIs and duplicate calls, third-party scripts, ads, analytics, and support widgets, then 404s, redirect chains, and retries.
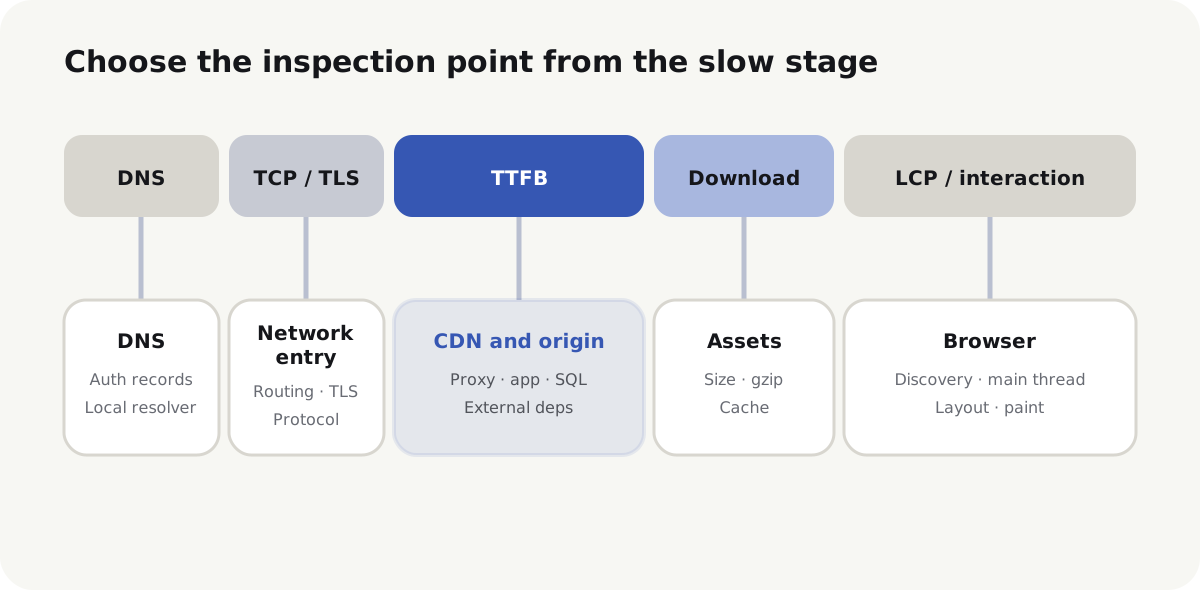
When HTML is fast, inspect rendering and LCP
If document TTFB is normal and the page stays blank or the main content appears late, the wait has moved from origin to resources and rendering.
LCP is usually a hero image, a heading block, or a poster. Check whether that resource is discoverable in the HTML, whether it is lazy-loaded, whether the download is large, and whether CSS or JavaScript delays the paint. Optimize Largest Contentful Paint(opens in a new tab) splits the metric into TTFB, resource load delay, resource load duration, and element render delay. Those four parts add up to LCP with no overlap. Compressing the file only shortens load duration; it does not fix a late request or a blocked main thread. Do not put loading="lazy" on the LCP image.
In the Performance panel, look for:
- tasks longer than 50 ms(opens in a new tab)
- heavy script parse and evaluate, and repeated layout
- font loading that delays text or shifts layout
- images without dimensions that reflow the page
- third-party scripts that occupy the main thread
Shrinking images does not fix a slow query. Adding a database index does not shorten a 4 MB hero download. Confirm on the timeline whether the time is in download, the database, or the main thread.
Align server logs with the same time window
On a self-hosted Compose host, align entry logs, container state, and host metrics to the window the user reported:
docker compose ps
docker stats --no-stream
ss -lntp
journalctl -u caddy --since '10 minutes ago' --no-pager
In the application, compare request duration, status codes, slow queries, connection-pool waits, cache hits, and external API time. Averages hide spikes. Keep at least p50, p95, p99, and error rate. Without a shared request ID, join logs by time, path, and upstream status.
| Evidence | More likely bottleneck |
|---|---|
| Host CPU pinned and the run queue rising | Compute or process contention |
| Memory exhausted with swap or OOM | Working set too large, a leak, or a limit that is too low |
| Disk await and util staying high | Logs, database, or volume I/O |
| The app is fast but proxy upstream time is high | Network, protocol, pool, or a logging mismatch |
| App and SQL tails rise together | Query, lock, pool, or data volume |
| Slow only around an external API call | Third-party latency, timeouts, and retry amplification |
Retest under the same conditions
Retest the same URL, region, network, device, cache state, and sampling method. Compare phase times, the waterfall, origin high percentiles, and error rate. Two Lighthouse totals cannot prove the bottleneck is gone.
Put the slow stage, the component, the change, and the metric shift on one timeline, and check whether the change created a new cache or error risk.
If the entry returns 502 or 504, the response already failed. Inspect the proxy that emitted the status, its upstream DNS, ports, and timeouts, instead of treating the page as a slow 200.
Should I start with the server when a website is slow? Not first. Split DNS, connection, TLS, TTFB, download, and rendering. Enter the server when evidence points at the wait after TLS or at origin resource saturation.
Does high TTFB mean backend code is slow? No. Field TTFB still includes redirect, DNS, connection, TLS, CDN origin fetch, and proxy wait. Subtract adjacent timings and read entry logs.
Can one Lighthouse run diagnose a slow website? No. One lab result is a clue. Keep the test conditions, and combine field data, the waterfall, and origin metrics. Lab and field data often disagree(opens in a new tab) because device, network, cache, and geography differ.
The homepage is fast, but users still say the website is slow. What should I check? The URL they opened, plus region, device, login, and time window. Detail-page APIs, third-party scripts, or a large image may exist only on that path.
How do I tell CDN slowness from origin slowness? Compare HIT, MISS, and origin for the same URL, and check Age, ETag, body hash, and entry logs. A fast cache hit with a slow origin fetch is not a rendering bug.